

The list for today:
| NEOG | |
| LPHI | |
| PETS | |
| STRA | |
| AFAM | |
| STE |
| AEX Index | 259,58 | 9,09% | S&P 500 Index | 930,09 | -1,11% |
| Dow Jones Indus. Avg. | 8990,96 | -0,82% | Nasdaq Composite | 1657,21 | 0,47% |
| AVAV |
| EBS |
| PSQ |
| CMTL |
| DLTR |
| HOMB |
| LPHI |
| APOL |
| MG767 |
| VASC |
| VITL |
| ICUI |
| AMCP |
| OZRK |
| CRI |
A massive rally on more than average volume.
| AEX Index | 237,96 | 0,36% | S&P 500 Index | 940,51 | 10,79% |
| Dow Jones Indus. Avg. | 9065,12 | 10,88% | Nasdaq Composite | 1649,47 | 9,53% |
Summary:
| AEX Index | 245,92 | -4,63% | S&P 500 Index | 876,77 | -3,45% |
| Dow Jones Indus. Avg. | 8378,95 | -3,59% | Nasdaq Composite | 1552,03 | -3,23% |
| AEX Index | 257,85 | 1,09% | S&P 500 Index | 908,11 | 1,26% |
| Dow Jones Indus. Avg. | 8691,25 | 2,02% | Nasdaq Composite | 1603,91 | -0,73% |

| AEX Index | 255,08 | -5,30% | S&P 500 Index | 896,78 | -6,10% |
| Dow Jones Indus. Avg. | 8519,21 | -5,69% | Nasdaq Composite | 1615,75 | -4,77% |
EBS
Here is the list for today:
1. QCOR
2. ITWO
3. SMN
4. NEOG
5. LPHI
6. CHRK
7. ENSG
8. ICUI
9. ALGT
10. MBFI
11. HBHC
12. GSIT
I am making a new layout for the old blog on investment ideas. For the meantime I shall be redirecting traffic to this blog . Sorry for any inconvenience. For all rss feed please use the current feed.

Here is the graph for DOW industrials. A clear flag pattern has formed. This will provide a downward impulse to the index. So expect a breakout on the downside unless something miraculous happens.
Although not shown here the nasdaq shows a similar formation. Moreover notice that volume on rise is below the average. So not a convincing rally at all today. Moreover notice the remarkable volume of sell off on 10th October. The highest intraday sell off in a year. All the sectors which have not yet broken down will probably break down. So watch and beware....
Market overview today:
| AEX Index | 269,41 | 6,80% | S&P 500 Index | 985,40 | 4,77% |
| Dow Jones Indus. Avg. | 9265,43 | 4,67% | Nasdaq Composite | 1770,03 | 3,43% |

| AEX Index | 252,26 | 1,70% | S&P 500 Index | 940,55 | -0,62% |
| Dow Jones Indus. Avg. | 8.852,22 | -1,41% | Nasdaq Composite | 1.711,29 | -0,37% |
So what’s wrong with gold? Why has the price not skyrocketed? Do you remember the day when Bear Stearns failed? Do you remember what happened on that day with gold? It spiked up to $1032 per ounce and marked its highest intraday price ever (in nominal price terms – remember, the inflation adjusted high would be in the $2300 per ounce range). Now in retrospect, doesn’t the Bear Stearns event look like some kindergarten party? Yes, the financial system has been under much more stress recently. What we have experienced in the last days was the biggest effort ever made to rescue the global financial system and it is still not clear if we are out of the storm. But nevertheless gold has even retreated to the $850 range. Does it looks strange or not?
In times where the entire financial system is on the edge, you would expect gold to soar because of its safe haven attributes. Obviously something is seriously wrong. Right now, we are experiencing two forces to fight with each other: the physical market and the paper market. To understand what’s going on you have to know that the paper market is the short term market and the physical market is the long term market.
The place of most attention for the paper gold market is the COMEX. The price you see in the newspaper is the price of the gold future traded on the COMEX. Unfortunately, it is a paper market which is very vulnerable for manipulation and it does not reflect the real market which takes place in physical supply and demand.
In the past, commodity producers used futures to hedge prices and in many cases physical delivery took place. Today, futures are by the majority just markets for speculators trading paper and not asking for physical delivery. Just remember what happened with oil some months ago – oil was trading at roughly $ 150/bbl and even official sources claimed that the reasons were demand and supply based – they neglected the effect from speculators and deep pocket institutional investors. Well, the high was set in July. Do you really think that demand has fallen that sharply or supply has caught up that fast since then? Maybe you remember the intraday spike in July which was responsible for the all-time-high? This was triggered by short-covering from a Texas based energy trading firm. Do you think this has something to do with demand and supply or do you think this is just a paper market movement? Yes, this is a paper market movement and for gold the price has been depressed.
Also remember, banks are not lending money to each other and they have to do whatever is possible to stay liquid. Have you ever heard of the gold carry trades? They are real and they are most likely at least responsible for a part of the paper selling pressure on gold. Central banks have loaned a portion of their gold holdings over the past years. GFMS and Virtual Metals have estimated that gold on loan position amounts to between 4000 and 5000 tons. GoldMoney believes the gold loan position is more likely to be 8000 tons to 15,000 tons, whereas Cheuvreux’s estimates central banks have lent as much as 10,000 tons to 15,000 tons of gold, which it suggests is between a third and half of the reported total of their reserves.
Banks were desperate to get cash and therefore were selling gold futures into the market – the futures were most likely covered by gold lent from central banks. I also assume that central banks were assisting in this procedure since it was another way to support the credit system. Actually, it was a very agreeable way since it was done without any public knowledge (and particularly without any media coverage) and without any immediate consequences on the monetary aggregates (at least for the short term). I can’t prove this action but there are many indications that this happened:

What about the long term implications of the bailout packages on gold? The possible threats are severe and will very likely lead to higher inflation. The sum of the overall bailout packages has now reached more than $4600 billion, huge isn’t it? The extremely aggressive fiscal and monetary policies now in place are ticking time bombs for inflation in the future. Right now, the world fears about deflation and inflation are not a threat. That’s true, but what happens if the official agencies now in charge are too late to tighten the monetary flood once economies are recovering? Yes, this will lead to a major inflationary backlog of potentially giant proportions.
I believe if very experienced and smart investors such as Mr Jim Rogers see inflation as a very real threat in the future, you should listen to them. You might want to watch this interview “Inflationary Holocaust” by Jim Rogers. Another interesting interview regarding the same issue and with further implications on currencies such as the dollar, euro and sterling is “Will bailouts risk hyperinflation?”
I picked up the topic of a global currency crisis in previous articles and I’m sure this will happen in the not too distant future. Remember, the value of a currency is in the long term determined by its fundamentals (and not short covering or pure safe haven buying as it happens right now in the US dollar). I expect the old economy currencies will devaluate against the currencies of the emerging countries, particularly Asian countries. They have huge amounts of money, economies with excellent long term growth potential and no hidden financial time bombs. Do you really think the US dollar is stronger or is it more likely that other currencies got weaker against the US dollar? That’s a very important difference.
The US dollar got stronger because of a giant flood of money pouring into the US treasury market. This was safe haven buying at its best. But when the storm calms, do you really think these investors feel comfortable? I don’t think so. In the mid to long term, the US dollar and the rest of the highly inflated global currencies will devalue. It’s also interesting that according to the World Gold Council, CBGA 2 signatories sold only 357 tons gold in year 4 of the agreement, well below the 500 tons ceiling. Are they running out of ammunition or did they finally understand that they'd better hold on to their gold since this is the backbone of their paper money?
So what’s going on in the gold market? Right now, we have a huge wave of paper gold coming into the market and therefore depressing the price of gold. I’m speaking about gold futures that have been sold by large unwinding transactions mainly from hedge funds which have to reduce their exposure or which are liquidated entirely. Lots of margin calls for private and institutional investors also played their part in this game.
A pretty new invention are the so called ETNs (Exchange Traded Notes) and virtually thousands of other paper products (called certificates, baskets, structured products, etc.). Do you remember the word ‘counterparty risk’? Does this ring a bell? Yes, it should. Even if you have bought an ETN or another paper based product on gold, it is not necessarily backed by physical gold, it is actually nothing else than a debenture with a payment guaranty of the issuer – a great product if the issuer is Lehman Brothers or Bear Stearns, etc. After Lehman Brothers went bankrupt, many investors found out that even their capital protected products were worthless. I strongly believe the current sell-off in commodities and also gold is a substantial part triggered by huge selling of paper products. So here we are again, the paper market vs the physical market.
The physical market is virtually exploding! Demand is so strong that you have to wait several days or even weeks before you get your physical gold (coins or bars). So how can you explain that physical demand is so incredible strong that you can’t get your coins and bars and the price of gold (remember COMEX paper market) is still falling? I can’t and this makes me think that something is seriously wrong and will eventually lead to a huge spike in the price of gold!
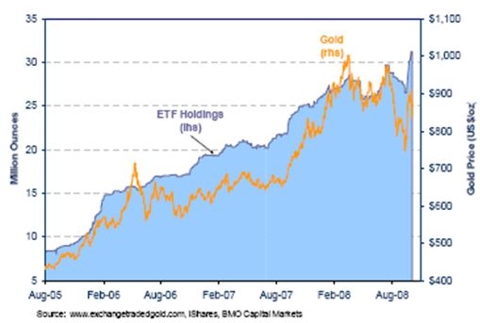
It is not only the physical demand that is very strong, it is also the gold ETFs which are adding up gold and just reached new record levels, but still the price of gold is falling.
There is one thing I don’t like about some of the gold ETFs. Did you know that some allow short selling? This looks like a minor issue but could have a major effect for investors who think they own a fund which is fully backed by physical gold. Maybe this is not the case: The ETF’s administrator only knows the net long position and backs this amount with physical gold.
Imagine, we have 100 long positions (from investors who want to have a fully backed gold ETF) and we have 50 short positions. Overall this means a net long position of 50 (and I guess the fund administrator only covers the net long position with physical gold). So what happens if the investors with the 100 long positions are asking for physical gold delivery? Well, there is only enough gold for 50 long positions in the ETF’s vaults. But the fund administrator has to deliver the physical gold for 100 long positions. Maybe this triggers a short squeeze in the physical gold market? I don’t like this idea and therefore I prefer holding physical gold in a vault or in an ETF which does not allow any short selling. Unfortunately, the world’s biggest gold ETF “SPDR Gold Shares” (GLD) allows short selling. I like the instrument as a vehicle to track the price of gold but I don’t like the short selling possibility.
Overall, the bull market in gold is far from over. Even though most investors don’t really understand what is going on with the price of gold. It’s like an elastic spring, the more you depress it, the higher it jumps once released. Right now, inflation is not a problem, but it might get one in the future again and this time probably even bigger than before. Besides of course other fundamental reasons to buy gold (e.g. growing jewelery demand from emerging countries, asset hedge, currency protection, etc.).
Investors should preferably buy gold stocks such as Goldcorp (GG), Barrick Gold (ABX), Newmont Mining (NEM), AngloGold Ashanti (AU) or Harmony Gold (HMY) to gain direct exposure and leverage to a rising gold price. But nevertheless, physical gold in fully backed gold ETFs or in gold coins/bars remains a core asset besides some gold equity holdings.
(Courtesy: seeking alpha)
| AEX Index | 248,04 | -5,69% | S&P 500 Index | 946,43 | 4,25% |
| Dow Jones Indus. Avg. | 8979,26 | 4,68% | Nasdaq Composite | 1717,71 | 5,49% |
| AEX Index | 263,00 | -7,56% | S&P 500 Index | 907,84 | -9,03% |
| Dow Jones Indus. Avg. | 8577,91 | -7,87% | Nasdaq Composite | 1628,33 | -8,47% |
A day of rally after the historically worst week of the last century. Let us see what the indices are up to:
| AEX Index | 285,27 | 10,55% | S&P 500 Index | 1003,35 | 11,58% |
| Dow Jones Indus. Avg. | 9387,61 | 11,08% | Nasdaq Composite | 1844,25 | 11,81% |
| ^VIX | 54.99 | -14.96 |
First the market statistics:
| AEX Index | 258,05 | -8,48% | S&P 500 Index | 899,22 | -1,18% |
| Dow Jones Indus. Avg. | 8451,19 | -1,49% | Nasdaq Composite | 1649,51 | 0,27% |
Another day of downward movements:
| AEX Index | 281,97 | -1,29% | S&P 500 Index | 909,92 | -7,62% |
| Dow Jones Indus. Avg. | 8579,19 | -7,33% | Nasdaq Composite | 1645,12 | -5,47% |
Another day of massive fall in us indices:
| AEX Index | 309,44 | -1,00% | S&P 500 Index | 996,23 | -5,74% |
| Dow Jones Indus. Avg. | 9447,11 | -5,11% | Nasdaq Composite | 1754,88 | -5,80% |

First the overview of the market indices:
| AEX Index | 312,56 | -9,14% | S&P 500 Index | 1056,89 | -3,85% |
| Dow Jones Indus. Avg. | 9955,50 | -3,58% | Nasdaq Composite | 1862,96 | -4,34% |